01Model
mid: ds = σ dW
reservation: r = s − q·γ·σ²·(T − t)
total spread: δa + δb = γ·σ²·(T − t) + (2/γ)·ln(1 + γ/k)
fill intensity: λ(δ) = A·exp(−k·δ)
Parameters follow the paper: σ = 2, A = 140, k = 1.5, T = 1, dt = 0.005, starting price 100. Fills are Bernoulli draws with probability λ·dt each step.
02Results
| γ | Strategy | Mean | Std | Mean/Std | 5th pct | |q| at close |
|---|---|---|---|---|---|---|
| 0.01 | inventory | 68.3 | 9.1 | 7.5 | 54.3 | 4.1 |
| 0.01 | symmetric | 69.0 | 14.1 | 4.9 | 49.3 | 6.9 |
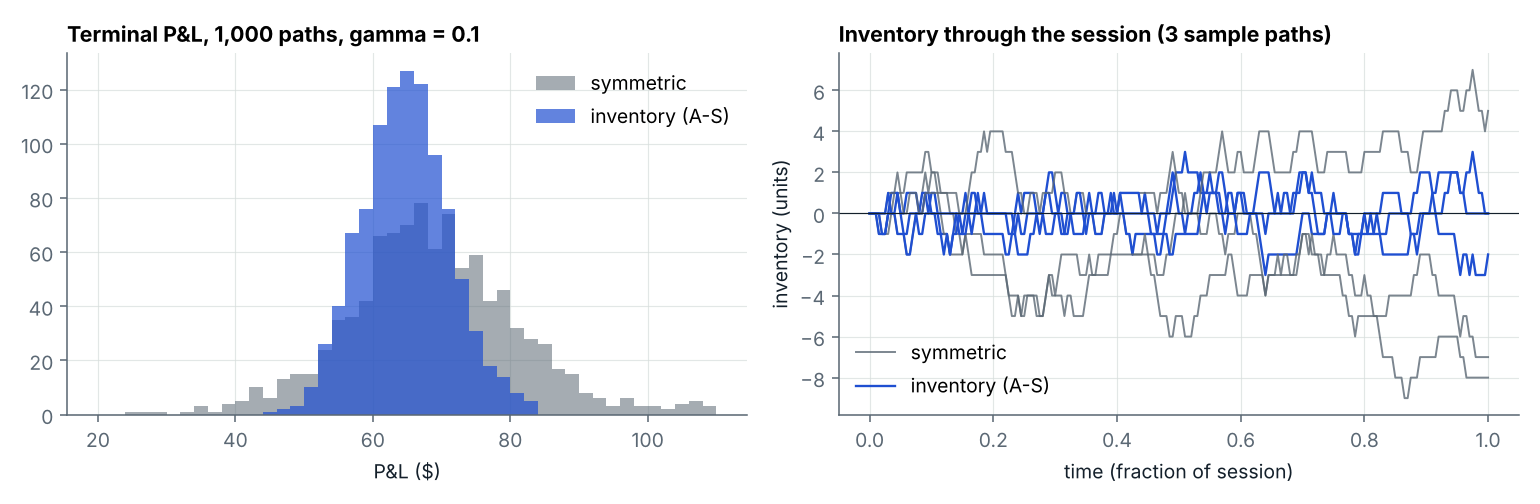
| 0.1 | inventory | 64.8 | 6.3 | 10.2 | 54.4 | 2.2 |
| 0.1 | symmetric | 68.5 | 13.6 | 5.0 | 47.9 | 6.7 |
| 0.5 | inventory | 48.5 | 5.9 | 8.2 | 39.2 | 1.5 |
| 0.5 | symmetric | 59.9 | 12.0 | 5.0 | 41.0 | 5.3 |
Higher γ means more risk aversion: tighter inventory, lower mean, but a steadier ratio of mean to risk. The paper reports 65.0 ± 6.6 against 68.4 ± 13.4 at γ = 0.1; this simulation gives 64.8 ± 6.3 against 68.5 ± 13.6.
03What this model leaves out
- Adverse selection: fills here are uninformed. Real fills cluster before the price moves against you.
- Queue position and tick size: quotes are continuous; real books are discrete and first-come first-served.
- Fees and rebates, which often decide whether a quoting strategy is profitable at all.
04What I'd do next
- Add informed order flow and measure the extra spread needed to break even.
- Replay a real order book and quote with queue position modelled.