01Motivation and hypotheses
Post-earnings drift is one of the most persistent anomalies in finance, and it is strongest where attention is low. ASX junior miners combine low coverage with frequent, material announcements: drill results, resource upgrades, offtakes. Their capacity is too small for large funds, which is exactly where a small trader can compete.
- H1. After positive price-sensitive news, abnormal returns continue in the direction of the first-day move for several days.
- H2. Very large first-day jumps (over 40%) reverse sooner than moderate ones.
- H3. Companies with short cash runways underperform after good news because a placement often follows.
02Data
Daily prices and volumes for all ASX codes since 2010, the S&P/ASX 200 as benchmark, and overnight commodity prices. In the live phase, every company announcement is logged with its timestamp, price-sensitive flag and text, and each company's latest Appendix 5B gives cash and estimated quarters of funding.
03Methodology
- Selection: the best cell per jump bucket maximises net return per day held among cells with t ≥ 2, in-sample only. Ranking on t alone drifted towards very long holds that capture unrelated later news.
- Clustering: events are averaged by date before the t-test, so many miners reacting to one gold move count once.
- Placebo: each event date moves to a random in-sample date, keeping same-day events together; p is the share of placebo runs that match the real result.
- Confirmation: a rule counts only if it is also positive out of sample with t ≥ 1.
04Validation on simulated data
The simulation plants H1 and H2: moderate pops keep running for about eight days and then fade; pops above 40% fade after two. Copper-linked stocks are given no edge at all.
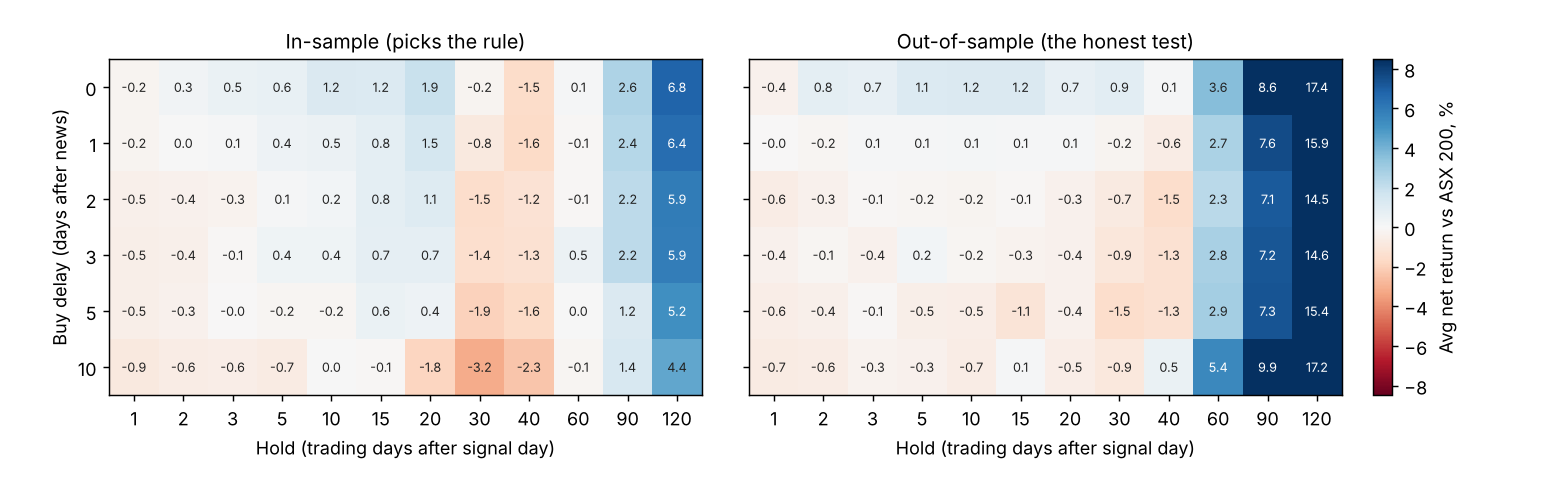
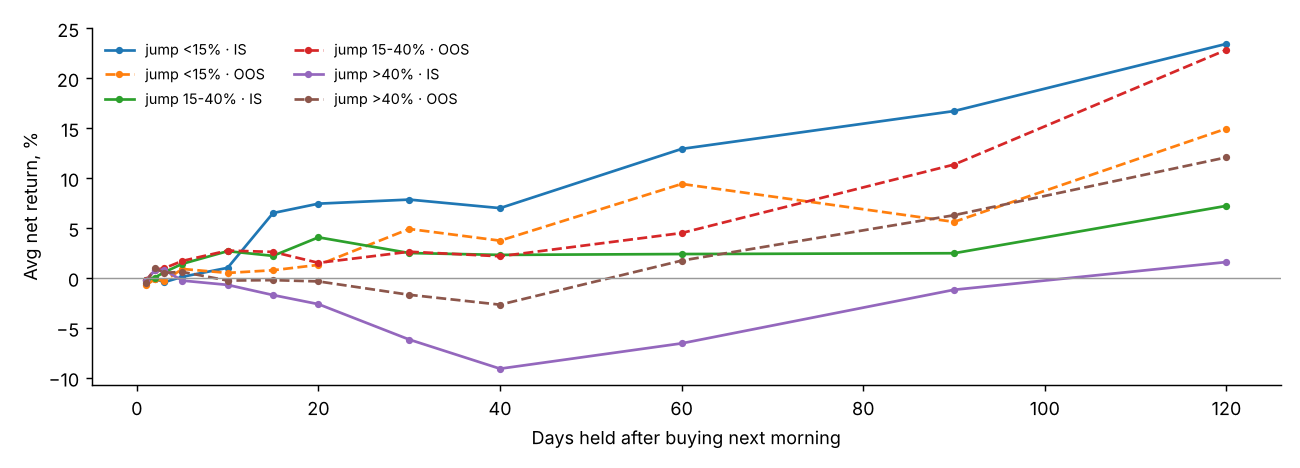
| Jump bucket | Rule picked in-sample | In-sample net (t) | Out-of-sample net (t) |
|---|---|---|---|
| 15–40% | buy day after, hold 5 | 1.48% (2.6) | 1.42% (2.4) |
| over 40% | buy next open, hold 2 | 0.79% (2.4) | 0.97% (1.6) |
| under 15% | buy 3 days after, hold 15 | 7.9% (2.3) | 1.5% (0.5), not confirmed |
The under-15% bucket shows why out-of-sample confirmation matters: a strong in-sample result on 42 events fails to hold up. On fully shuffled data with no effects, zero rules pass.
05Execution
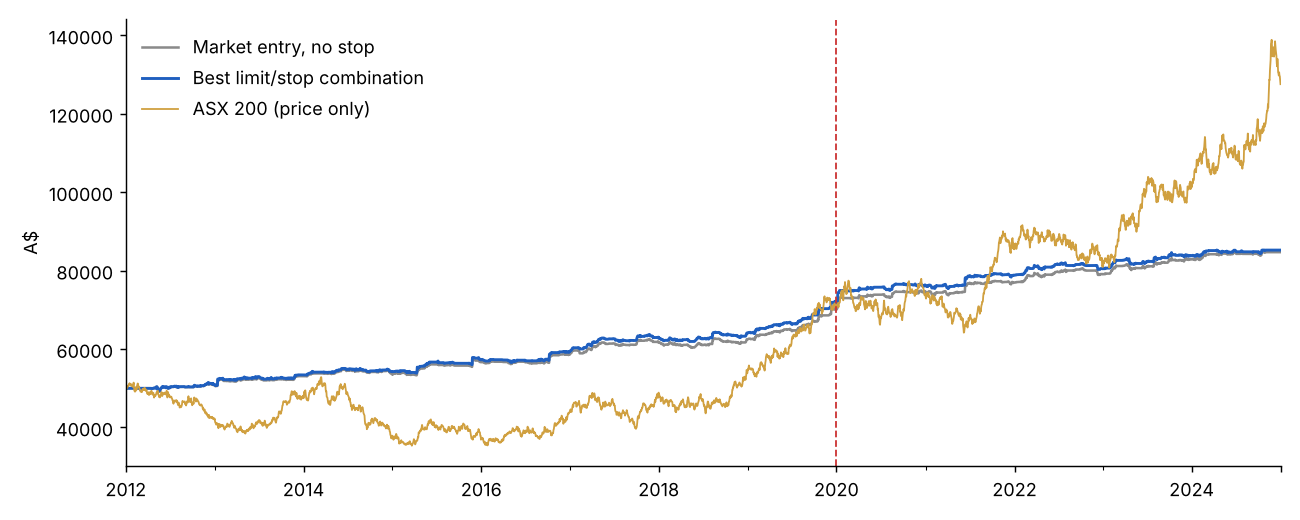
- A tight 8% stop looked best in-sample and lagged out of sample: juniors move that much on noise.
- A 1% limit missed 12–18% of trades, mostly the strongest runners; a 3% limit filled about 99%.
- Gaps through a stop fill at the open, which the model enforces.
06Live forward test
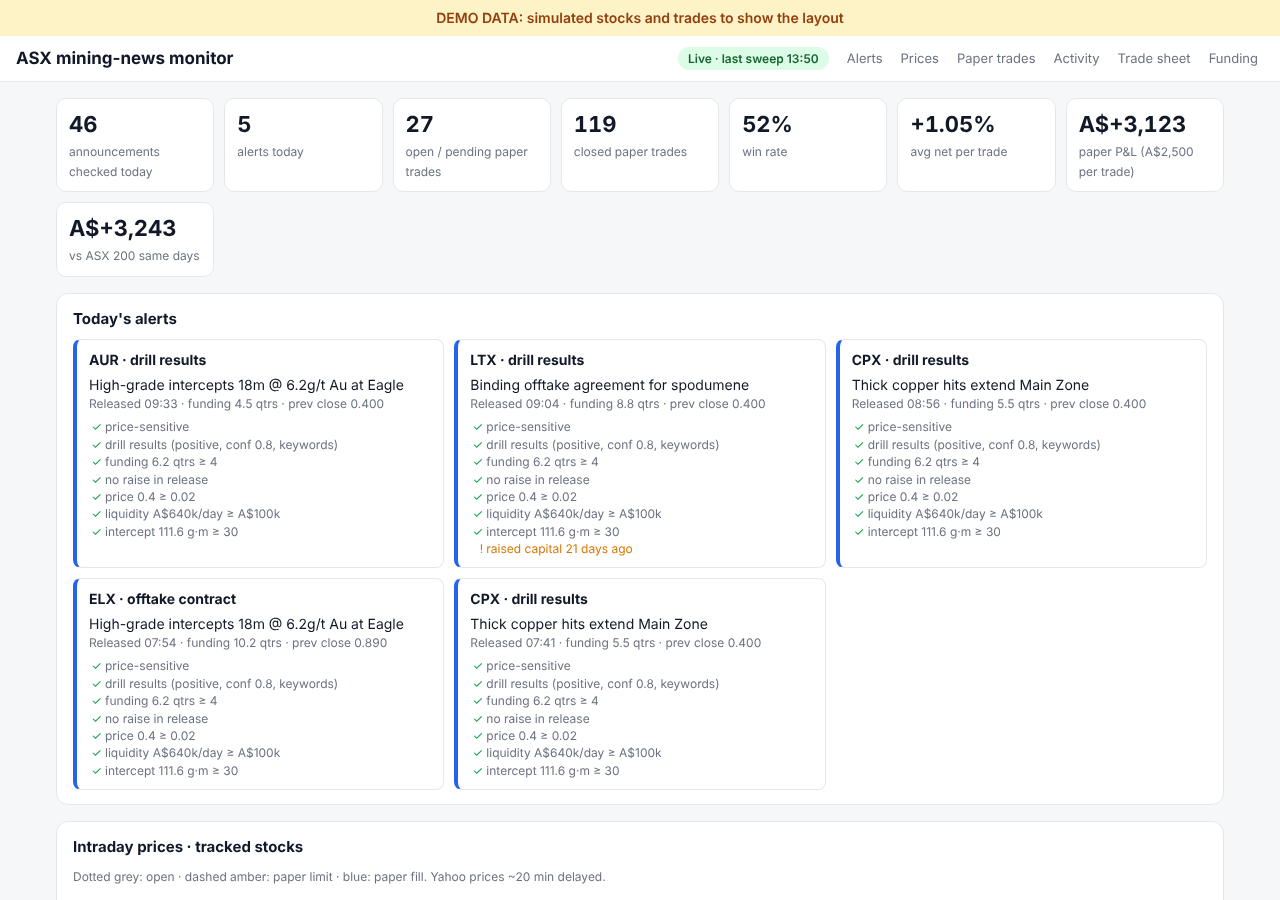
A monitor sweeps every resource company's announcements every ten minutes during the ASX release window. Each qualifying announcement (price-sensitive, positive category, at least four quarters of funding, no raise in the release, liquid) is paper traded two ways, to test whether speed is worth paying for: buying the first opening auction after the news, or waiting for the day-0 reaction and applying the backtested rule. A placement within three days flags the trade, which tests H3 directly.
07Limitations
- Survivorship: free price data omits delisted juniors, which biases long holds upward. A dataset that includes delisted stocks is the fix.
- Event proxy: history infers news from price and volume, which mixes news types. The live log of real announcements replaces it over time.
- Multiple testing: picking among 72 cells per bucket overstates in-sample results; out-of-sample confirmation and stable regions are the defence.
- Costs: small-cap spreads widen in fast markets beyond the model.
08References
- Ball, R. and Brown, P. (1968). An empirical evaluation of accounting income numbers. Journal of Accounting Research.
- Bernard, V. and Thomas, J. (1989). Post-earnings-announcement drift: delayed price response or risk premium? Journal of Accounting Research.
- Jegadeesh, N. and Titman, S. (1993). Returns to buying winners and selling losers. Journal of Finance.
- MacKinlay, A. C. (1997). Event studies in economics and finance. Journal of Economic Literature.
- Harvey, C., Liu, Y. and Zhu, H. (2016). … and the cross-section of expected returns. Review of Financial Studies.